How to Optimize your UA Campaigns with Creative and Ad Group Attribution Data
Overview
In this use case, you will learn how to use creative and ad-group level attribution information to improve your user acquisition campaigns across ad networks using a Google Data Studio/Looker Studio dashboard.
This article will give you a better understanding of how creative and source ID level attribution information can be visualized in Google Data Studio, and how different metrics can help improve the overall return on ad spend (ROAS).
Introduction
App publishers look at multiple data sources and analyses on a daily basis to improve their user acquisition (UA) activities and achieve the highest return on investment (ROI). These data sources include MMPs, ad networks, mediation channels, product analytics platforms, and more.
We understand that looking at various data points at different granularities and across different sources and dashboards can be extremely overwhelming, that is why we have created this use case to help you make better and faster decisions.
Creative and Ad Group Attribution Data
If you use Tenjin as your MMP, you can access raw data via their DataVault service for an in-depth analysis of attribution data, aiding your UA decision-making. GrowthFullStack facilitates automated data transformations for easy visualization in BI tools like Google Data Studio.
GrowthFullStack offers pre-configured raw data transformations to calculate advanced attribution metrics like LTV, ROAS, and Retention Rate at the creative and ad-group levels, surpassing standard CTR and CVR measurements from ad networks.
Let’s have a look at what the dashboard templates with creative attribution information could look like below.
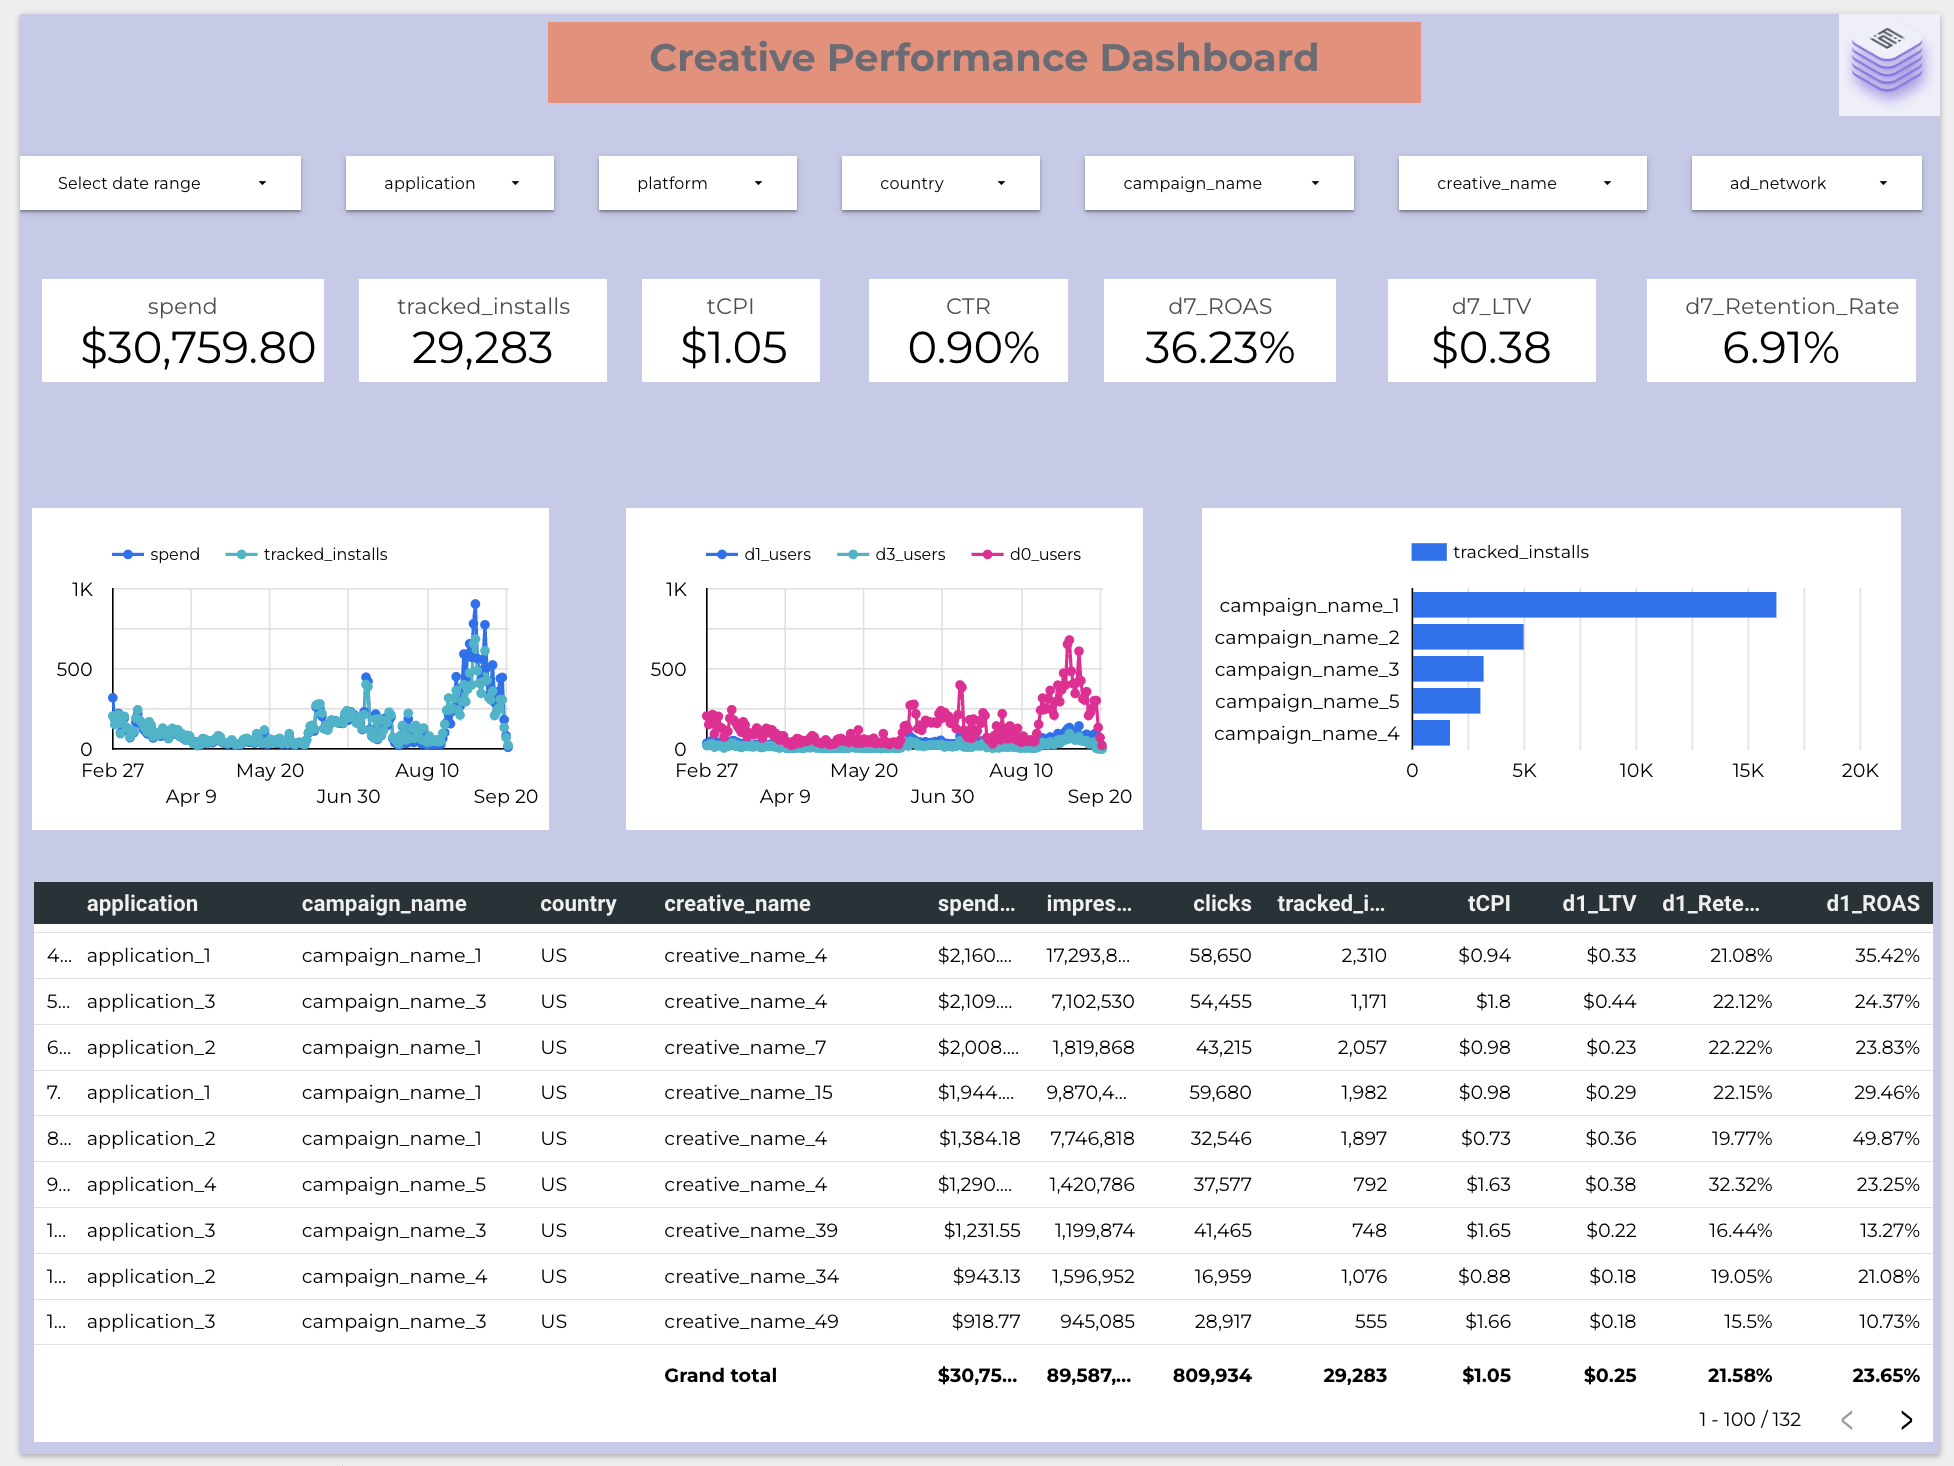
Here is a Google Data Studio dashboard example with creative-level attribution from Tenjin’s DataVault:

The dashboard shown above allows you to utilize multiple filters such as date range, campaigns, countries and apps to dig deeper into the other charts and tables.
The major metrics shown here are as follows:
Spend: The total amount spent across ad channels
Tracked Installs: The total tracked installs received
tCPI: Cost per Tracked Install
CTR/CVR: Click-Through-Rate/Conversion-Rate
DX_ROAS: Return on Advertising Spend cohorted for Day 1, Day 3 or Day 7
DX_LTV: LIfetime Value across cohorts for Day 1, Day 3 or Day 7
DX_Retention_Rate: Retention Rate of users across cohorts for Day 1, Day 3 or Day 7
The dashboard contains multiple views to improve the understanding of which creatives are working best across your campaigns.
From the table in the screenshot above, it is evident that creative 4 for application 2 in campaign 1 is performing the best in terms of Day 1 ROAS, while creative 4 on campaign 5 gets you users with the best retention rate. Therefore, it would make sense to either use this creative across other campaigns and countries or improve other creatives based on your intuition about why they might be under-performing.
Other views such as app split and trend lines allow you to make other inferences across multiple days on which campaigns were run.
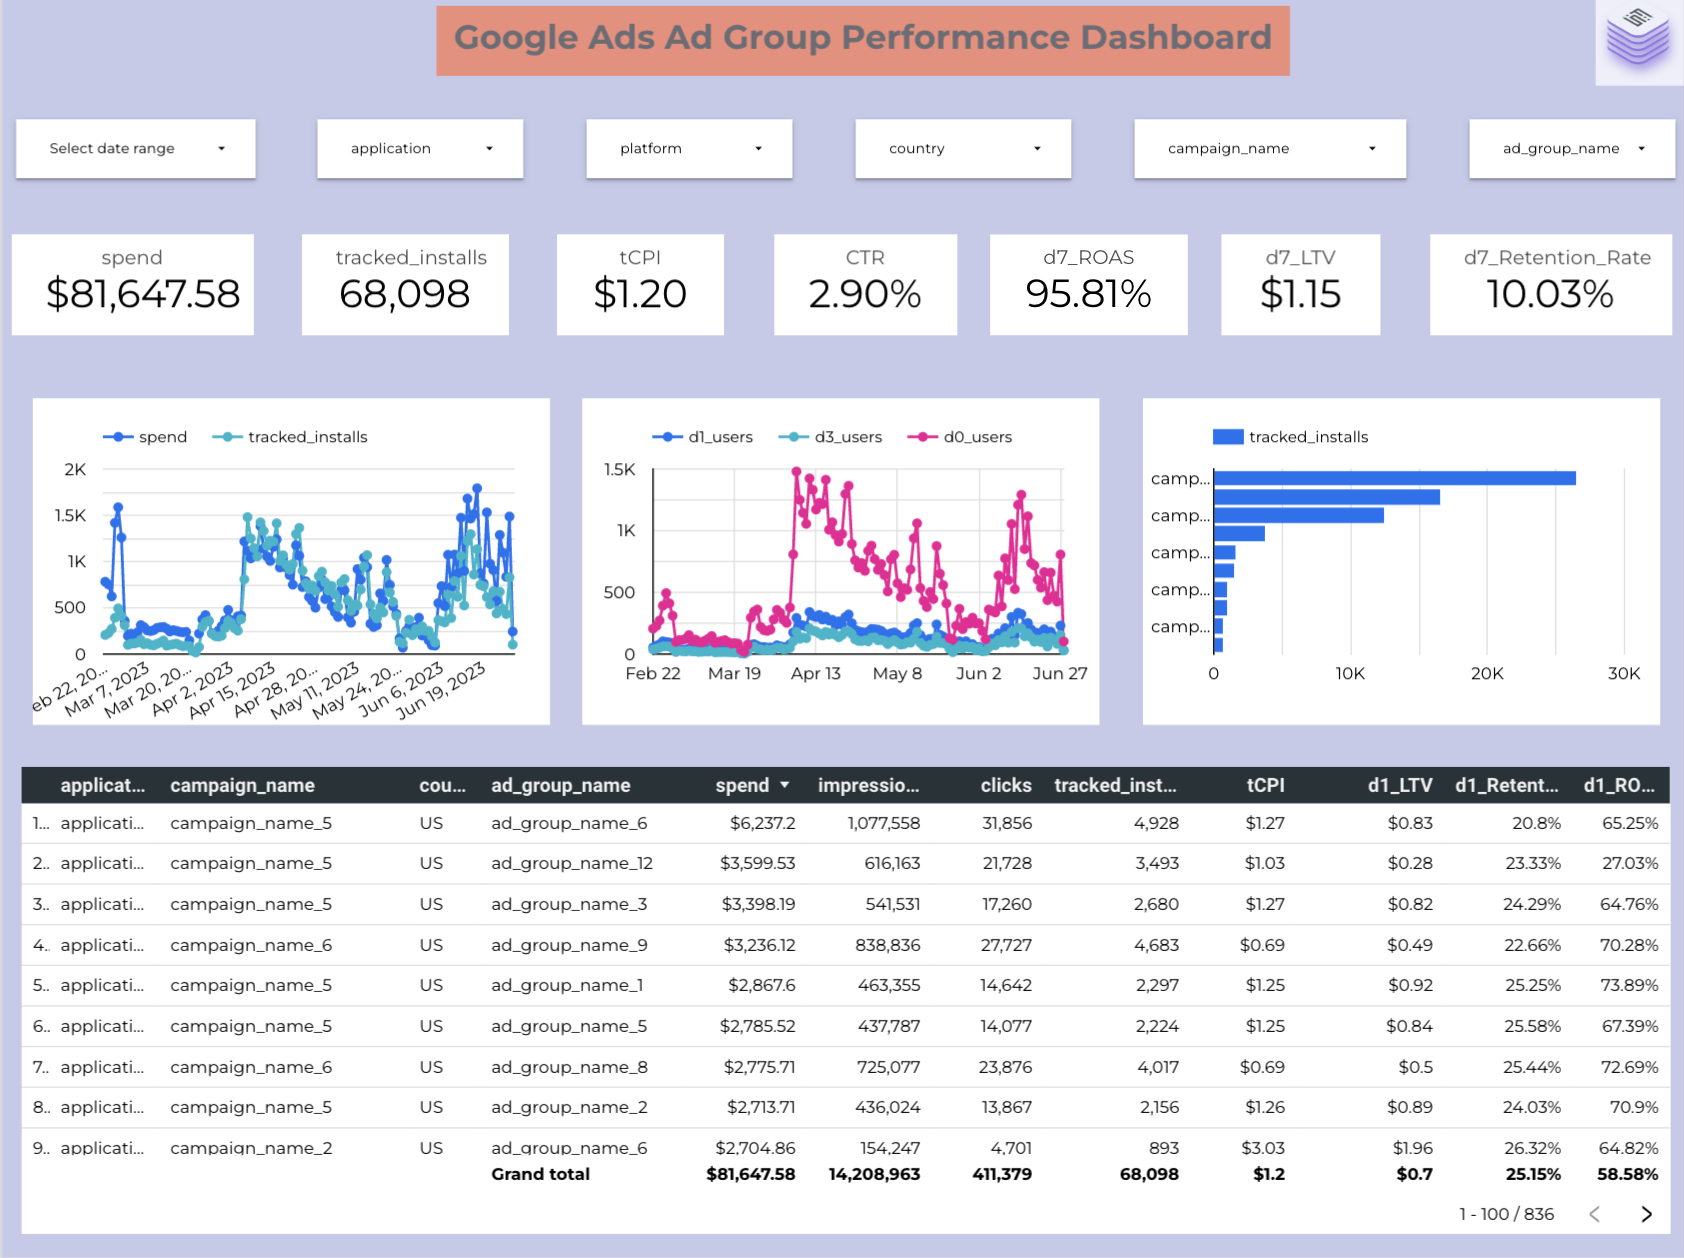
We provide a similar dashboard view with ad-group data for Google Ads:

Going deeper in your analysis will enable you to make informed decisions and aid your user acquisition efforts. Growth FullStack’s integration with Tenjin’s DataVault enables you to get the most precise information at the most granular level. With such dashboards in place, you would no longer need to look at multiple dashboards for each of your channels to make key business decisions. We can help you create a consolidated view so you can save time, and focus on improving the performance of your UA campaigns across ad channels.
How you can set up the creative and ad-group dashboard with Growth FullStack (step-by-step)
Growth FullStack customers who want to use our no-code data pipeline services can use this dashboard as a template. Follow the steps below to get started:
Step 1: Contact your Tenjin Account Manager to help set up DataVault, and then commission a creative or ad-group level transformation.
Step 2: Connect to your Google Data Studio account. If you don’t already have an account, you can create one here for free.
Step 3: Click on this link to view our anonymized template.
Step 4: Make a copy of the report in the template. This will show you a pop-up.
Step 5: Select a data source. You will need to replace the demo dataset with the transformation table in your DataVault.
What you need
You need to have DataVault and must use Tenjin as your MMP. Please reach out to your Tenjin account manager if you need help.
FAQ
Can this dashboard be personalized as per my requirements?
Yes. In the Calculated Fields section of Data Studio, you will be able to see the available fields, metrics and dimensions.
Your Growth FullStack Account Manager will be able to help you personalize this dashboard.
Is this dashboard supported with other tools?
Yes, we can build something similar with Tableau, Looker, Mode and other BI Tools. Contact your Growth FullStack Account Manager for more details.
Feedback
Do you have any feedback for us?
We at Growth FullStack are always happy to receive your valuable feedback. Whether it’s about requesting additional support on optimizing your workflows, building a customized dashboard, or anything else, feel free to reach out to us and let us know how we can support you further.
Iterate and Maintain
Iterate
This dashboard can be edited to reflect the metrics that you think fit. Additionally, DataVault offers data at various levels of breakdown which allows for different kinds of analyses. You can find details of available breakdown and types of data in the Tenjin DataVault documentation here.
Maintain
Please be aware that updates in DataVault schema or the associated transformation may break this template.