ironSource Site ID & Tenjin’s DataVault ROI
Overview
Learn which apps get you the most installs and generate the highest ROI
Upon completion of this training, you can expect to have a comprehensive overview on how to build a Google Data Studio dashboard that combines data from the ironSource API with Tenjin’s DataVault and allows you to get more insight into your data.
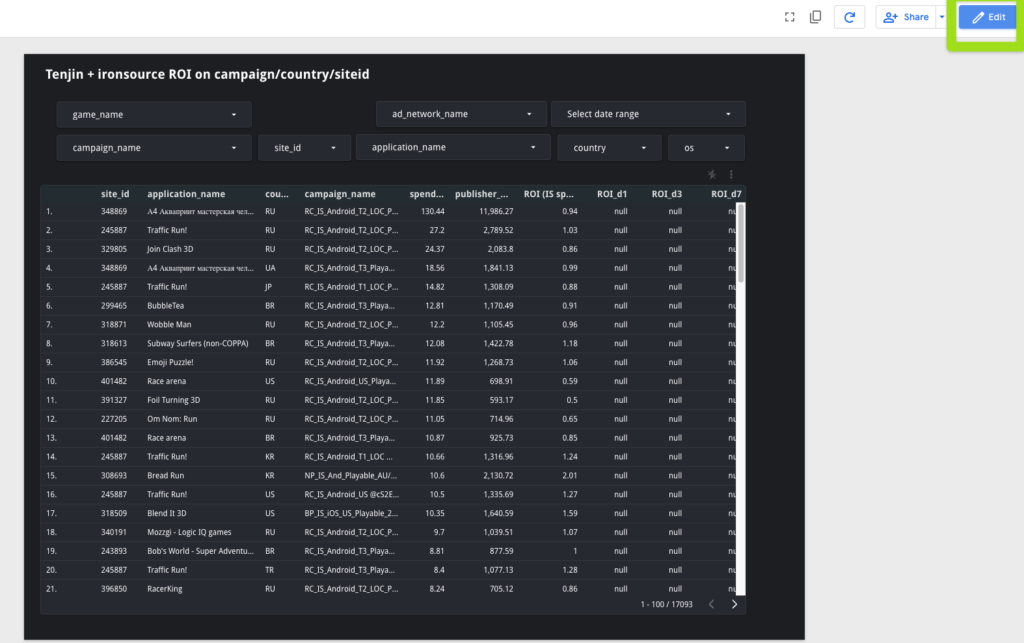
Here’s a glimpse of what the dashboard view with these combined metrics and data in Google Data Studio could look like:

Feel free to click through steps 1-6 to learn more about this.
Important Note: All our Paid trainings include SQL/dashboard/script for which access is only provided to customers who have a paid subscription to the service. You can get in touch with us if you would like to subscribe.
Summary
What you will learn
Upon completion, you will be able to:
- Join data from the ironSource Metrics API with Tenjin’s DataVault
- Create and explore a dashboard with combined data and metrics
- Calculate ROI at a campaign, country and site ID level
How it works
We get the reporting data (spend, impressions, clicks, installs) at the site ID level from the ironSource API and combine this with the DataVault site ID data to calculate ROI at the site ID & country level granularity for your apps and campaigns.
Setup
Customize your dashboard to meet your needs
This dashboard is built on top of anonymized data from the ironSource Reporting API and Tenjin’s DataVault, and can be easily customized for your apps. Users who want to run their own ETL can use this dashboard to understand the use cases of both datasets and spec out the view your data analysts should build.
Step-by-step guide on how you can set up your dashboard
Growth FullStack customers who want to use our managed ETL pipeline services can use this dashboard as a template. Follow the steps below to get started:
Step 1: Connect to your Google Data Studio account. If you don’t already have an account, you can create one here for free.
Step 2: Open our anonymized template.
Step 3: Click on the icon that allows you to make a copy of the report inside the template. This will show you a pop-up.
Step 4: Select a data source. You will then be able to see ‘view_ironsource_revenue’ as a new data source. You need to be logged in with the Google account that has access to the dataset where the data was loaded. You can check if you have access by clicking here. This will allow you to see the template with your own metrics.

How to
Get access to the anonymized template below:
Note: This template is available for a wide range of BI tools such as Looker, Metabase or Tableau. Feel free to get in touch with your Growth FullStack Account Manager for any additional details on the matter.
Learn how to analyze the metrics on your ‘ironSource Site ID with Tenjin’s DataVault ROI’ dashboard
With this dashboard you can view tracked installs or clicks on a site ID level, and calculate your ROI at that granularity. This dashboard helps you understand which of your apps are the most successful.
You can also see the Tenjin + ironSource ROI on a campaign/country/site ID granularity. This view can help you understand which of your site IDs & countries get you the most installs, and generate the highest ROI.

FAQ
Can I personalize this dashboard?
Yes. Check out our step-by-step guide on the process below.
Step 1: Merge the ironSource Metrics API with Tenjin’s DataVault
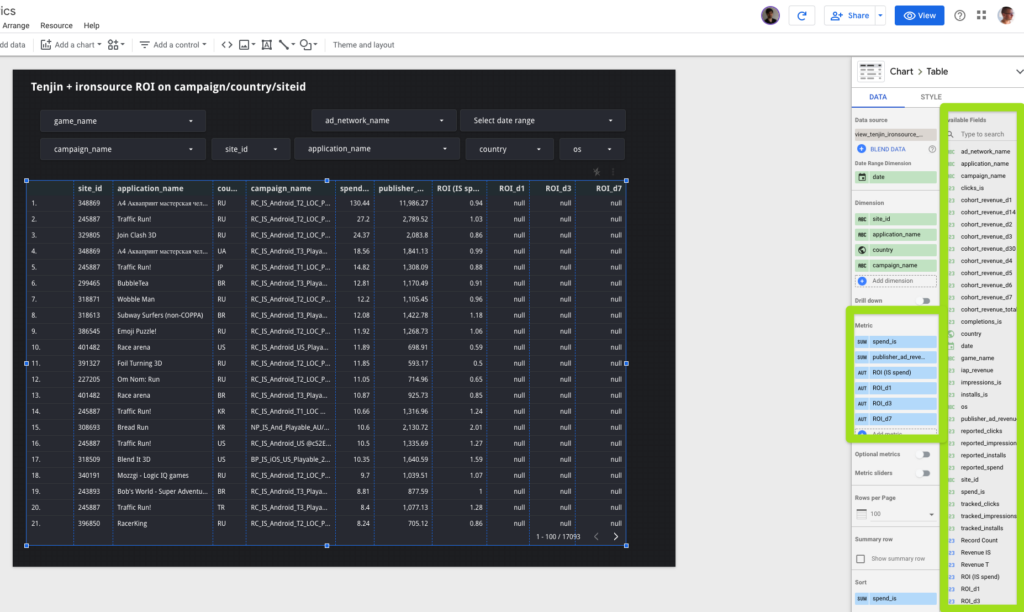
Step 2: Use the available fields and dimensions in the Calculated Fields section of Google Data Studio to personalize your dashboard
Step 3: Sit back and use your data insights to learn about which apps get you the most installs and generate the highest ROI
Do you still have questions about the process?
No worries! Your Growth FullStack Account Manager is an expert on this process and can guide you from start to finish.
Feedback
Do you have any feedback for us?
We at Growth FullStack are always happy to receive your valuable feedback. Whether it’s about requesting additional support on optimizing your workflows, building a customized dashboard, or anything else, feel free to reach out to us and let us know how we can support you further.
Iterate and Maintain
Iterate
This dashboard can be edited. Please read this information on Controls in Google Data Studio before using this dashboard.
Maintain
Please be aware that any updates to the ironSource API and Tenjin’s DataVault might break this template.


