How to Optimize Your Game Using App Version Analysis
Overview
In this use case, you will learn how to use app version data to make sure the newer version of your app has better retention and return on ad spend (ROAS) using a Google Data Studio/Looker Studio dashboard. This analysis is similar to a A/B test analysis.
Introduction
While typically app publishers look at their product analytics plateform to measure the performance of their app version using retention as the main metrics. But by joining multiple data sources such as MMPs, ad networks, mediation data they can get a richer picture by including metrics like cohorted LTV per user and ROAS.
We understand that looking at various data points across different sources and dashboards can be extremely overwhelming, that is why we have created this use case to help you make better and faster decisions.
App Version Data from your attribution provider
Most attribution provider will be able to provide you user- or event-level data access, sometimes called “raw data”. The benefit of using attribution data is that it will usually also includes in-app and ad revenue as well as cost data, which will enable you to calculate ROAS. If you don’t have attribution data access, no worries, you can use your product analytics data that will need to be merge with the data of the UA channels you use.
In both case GrowthFullStack offers pre-configured raw data transformations to calculate advanced attribution metrics like LTV, ROAS, and Retention Rate at the app version levels, surpassing your product analytics dashboard that only provides retention.
Let’s have a look at what the dashboard templates with app version analysis could look like below.
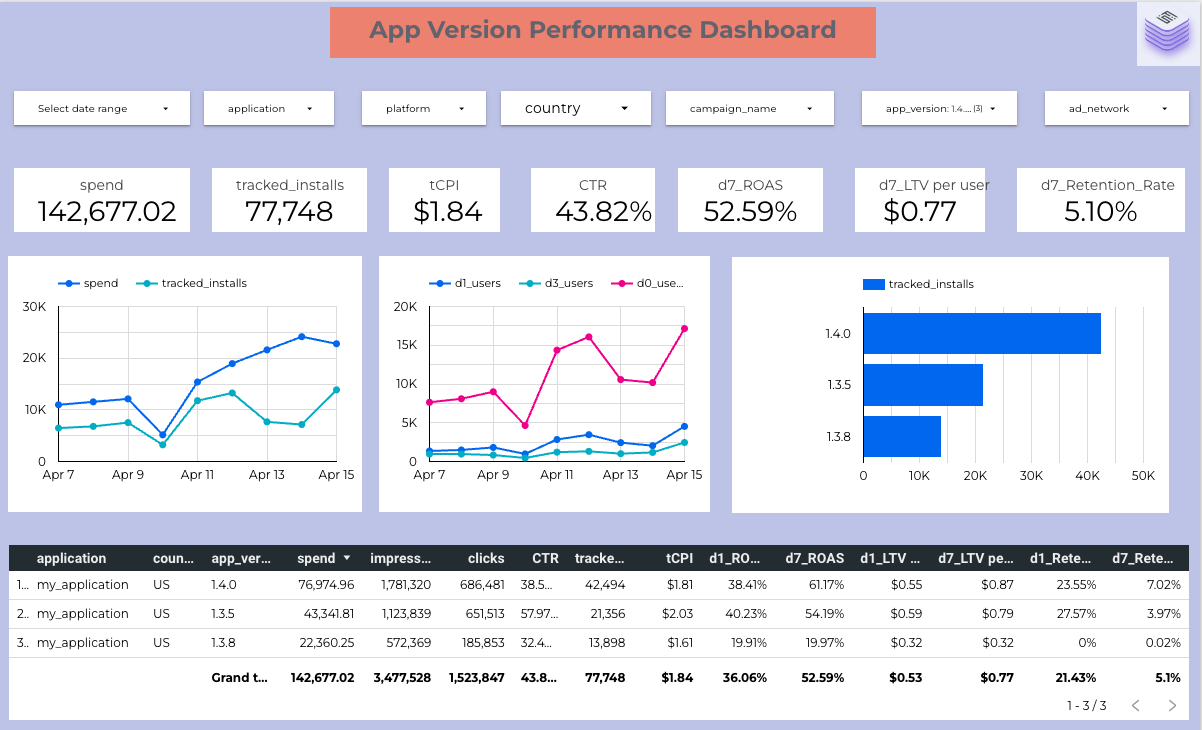
Here is a Google Data Studio dashboard example with app version-level analysis:

The dashboard shown above allows you to utilize multiple filters such as date range, applications, countries, campaigns, app version and ad networks to dig deeper into the other charts and tables.
The major metrics shown here are as follows:
Spend: The total amount spent across ad channels
Tracked Installs: The total tracked installs received
tCPI: Cost per Tracked Install
CTR: Click-Through-Rate
DX_ROAS: Return on Advertising Spend cohorted for Day 1, Day 3 or Day 7
DX_LTV: LIfetime Value across cohorts for Day 1, Day 3 or Day 7
DX_Retention_Rate: Retention Rate of users across cohorts for Day 1, Day 3 or Day 7
The dashboard contains multiple views to improve the understanding of which app version is performing best.
From the table in the screenshot above, even thou app version 1.4 do not outperform app version 1.3.5 at Day 1, it demonstrates better performance at Day 8 for all metrics, retention rate, user LTV and ROAS.
How you can set up the App Version Analytics dashboard with Growth FullStack (step-by-step)
Growth FullStack customers who want to use our no-code data pipeline services can use this dashboard as a template. Follow the steps below to get started:
Step 1: Sign-up to Growth Fullstack for free and click “Create a New Stack” to choose which data source and data warehouse destination we should use.
Step 2: Select the transformation “App Version Perspective” for Growth FullStack to join and transform the data for you.
Step 3: Connect to your Google Data Studio account. If you don’t already have an account, you can create one here for free.
Step 4: Click on this link to view our anonymized template..Make a copy of the report in the template. This will show you a pop-up.
Step 5: Select a data source. You will need to replace the demo dataset with the transformation table in your Data Warehouse.
If you do not have a Data Warehouse, do not see the transformation you want available for the attribution provider you pick or if you need any kind of help please click “Book a Demo” on the top right for us to assist you in a screen-sharing meeting.
What you need
You need raw data access to your MMP or raw data access to your product analytics tool and the API key access to your UA channels. Please reach out to your Tenjin account manager if you need help.
FAQ
Can this dashboard be personalized as per my requirements?
Yes. In the Calculated Fields section of Data Studio, you will be able to see the available fields, metrics and dimensions.
Your Growth FullStack Account Manager will be able to help you personalize this dashboard.
Is this dashboard supported with other tools?
Yes, we can build something similar with Tableau, Looker, Mode and other BI Tools. Contact your Growth FullStack Account Manager for more details.
Feedback
Do you have any feedback for us?
We at Growth FullStack are always happy to receive your valuable feedback. Whether it’s about requesting additional support on optimizing your workflows, building a customized dashboard, or anything else, feel free to reach out to us and let us know how we can support you further.
Maintain
Growth FullStack will provide maintenance for any breaking changes on the data sources. Please contact us if you think it might be the case.