How to Effectively Reduce your User Acquisition Costs with Portfolio LTV Analysis
🤔Why Portfolio LTV Analysis?
Portfolio LTV analysis is the secret sauce to reducing your CPI.
If you have more than one mobile app, leveraging cross-promo campaigns and calculating Portfolio LTV can be a game changer.
What is Portfolio LTV Analysis?
Portfolio LTV is the sum of the value a user generates across all apps within a publisher’s portfolio.
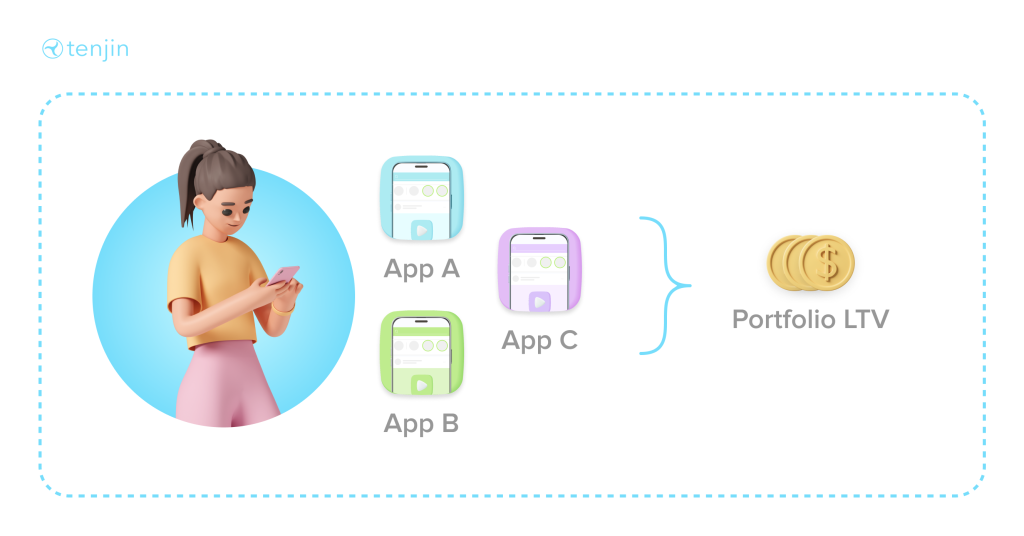

Introduction to Portfolio LTV:
https://www.youtube.com/watch?v=gb9-YJTAz58&t=1670s
To help better put this into perspective, let’s look at some use cases.
Use Case 1: Identifying Top Users and Enhancing Cross-Promotion
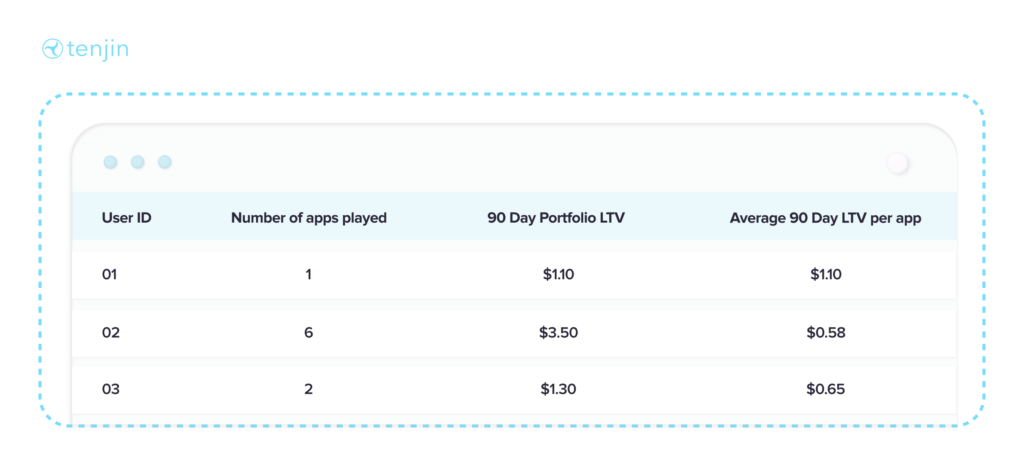
Imagine the scenario illustrated in the image below where you have a dataset of users as well as the number of games those users have engaged with in your portfolio. By analyzing this data, you can identify high-value users and target them with cross-promotions rather than traditional ads. For instance, if a user’s 90-Day Portfolio LTV is significantly high, you might opt to show them 80% cross-promotions and only 20% ads. This strategy can guide them towards other games in your portfolio, maximizing their overall engagement and value.
Use Case 2: Optimizing User Paths to Boost Spending
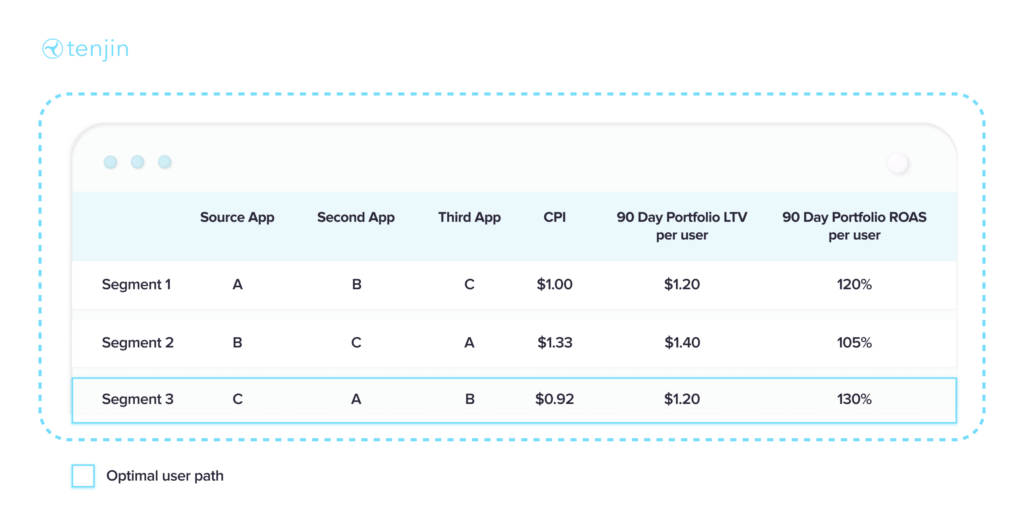
By examining the journey of users exposed to cross-promotion across various apps, you can determine the most effective user paths. For example, if users moving from App C to App A to App B generate the highest 90-Day Portfolio ROAS (Return on Ad Spend) and have the lowest CPI (Cost Per Install), you can allocate more budget to acquiring users for App C and cross promoting them to App A and then App B. This strategy ensures cost-effective user acquisition and maximizes ROI.
Use Case 3: Evaluating Campaign-Level Portfolio LTV
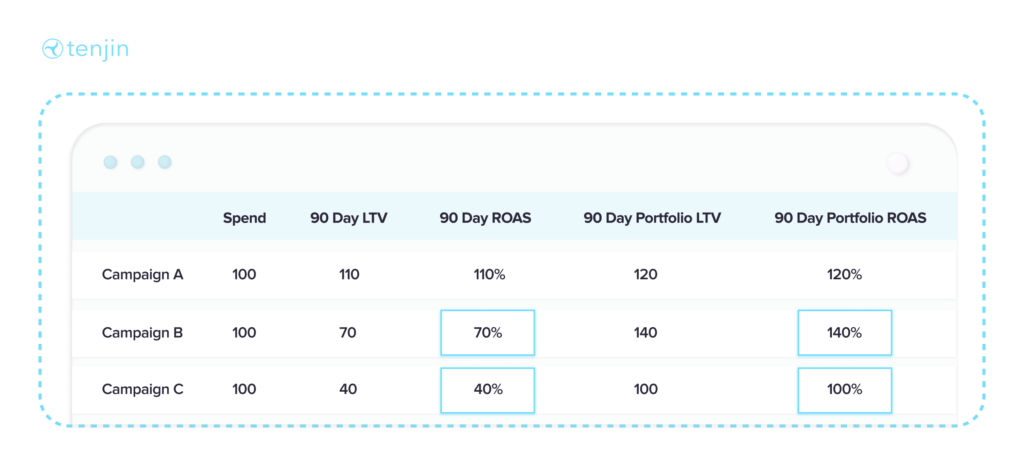
Analyzing Portfolio LTV at the campaign level provides a broader perspective on campaign performance. Instead of assessing campaigns based solely on individual app metrics, consider their contribution to the overall Portfolio LTV and ROAS. Campaigns that may seem less valuable on an individual level could significantly enhance your portfolio’s overall performance when viewed holistically.
In the example below, focusing solely on the 90 Day LTV or 90 Day ROAS for each individual app may cause you to overlook the fact that the campaigns in rows 2 (with a 70% 90 Day ROAS) and 3 (with a 40% 90 Day ROAS) are actually high-value when considering their Portfolio LTV or ROAS values.
How Hyperbeard Boosted Portfolio ROAS by 35% Using Portfolio LTV:
https://www.youtube.com/watch?v=02Pr4cEBMlc
Here is a Looker Studio dashboard template with LTV Portfolio Analysis
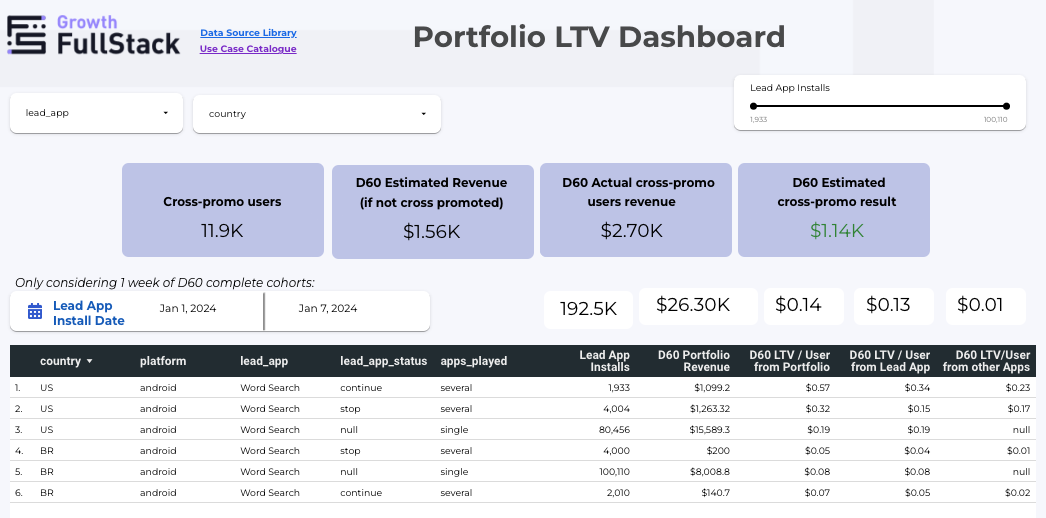
How you can set up the Portfolio LTV Analysis dashboard with Growth FullStack (step-by-step)
Growth FullStack customers who want to use our no-code data pipeline services can use this dashboard as a template. Follow the steps below to get started:
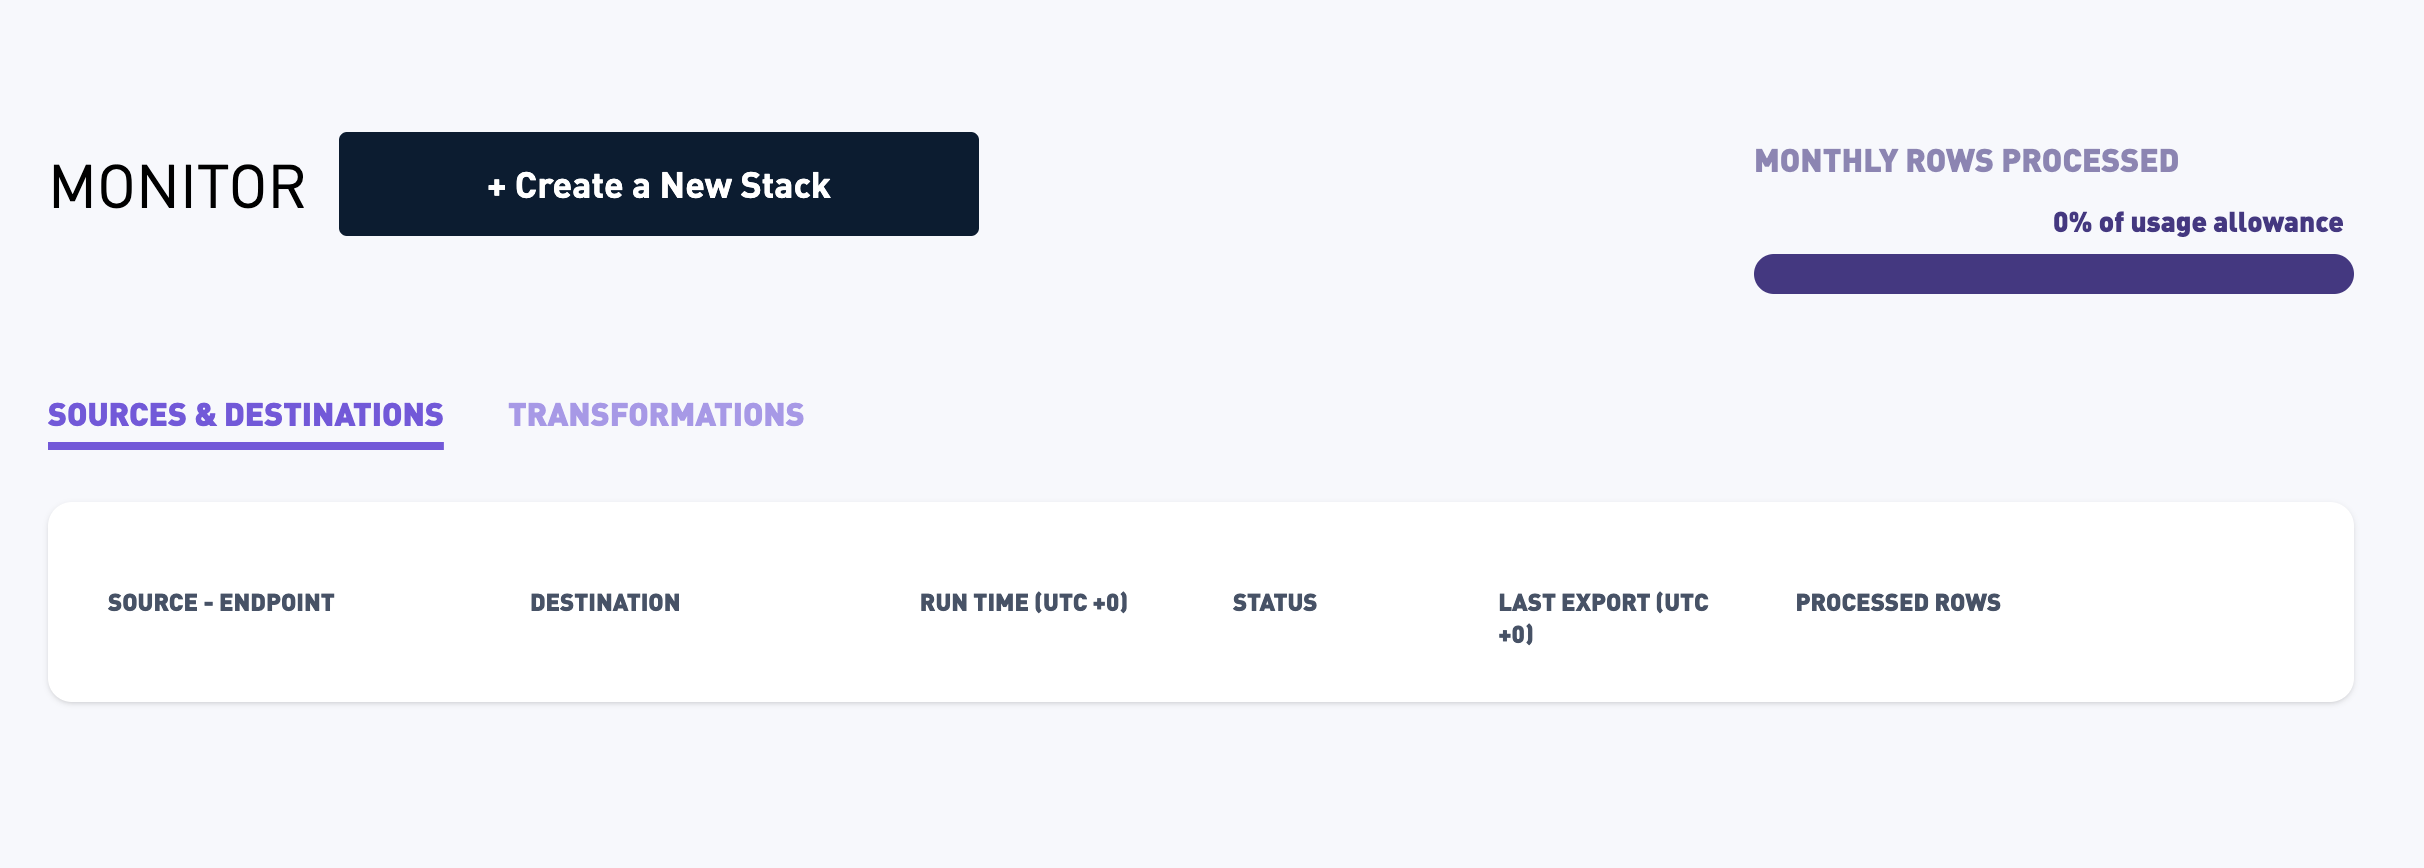
Step 1: Sign-up to Growth Fullstack for free and click “Create a New Stack”.
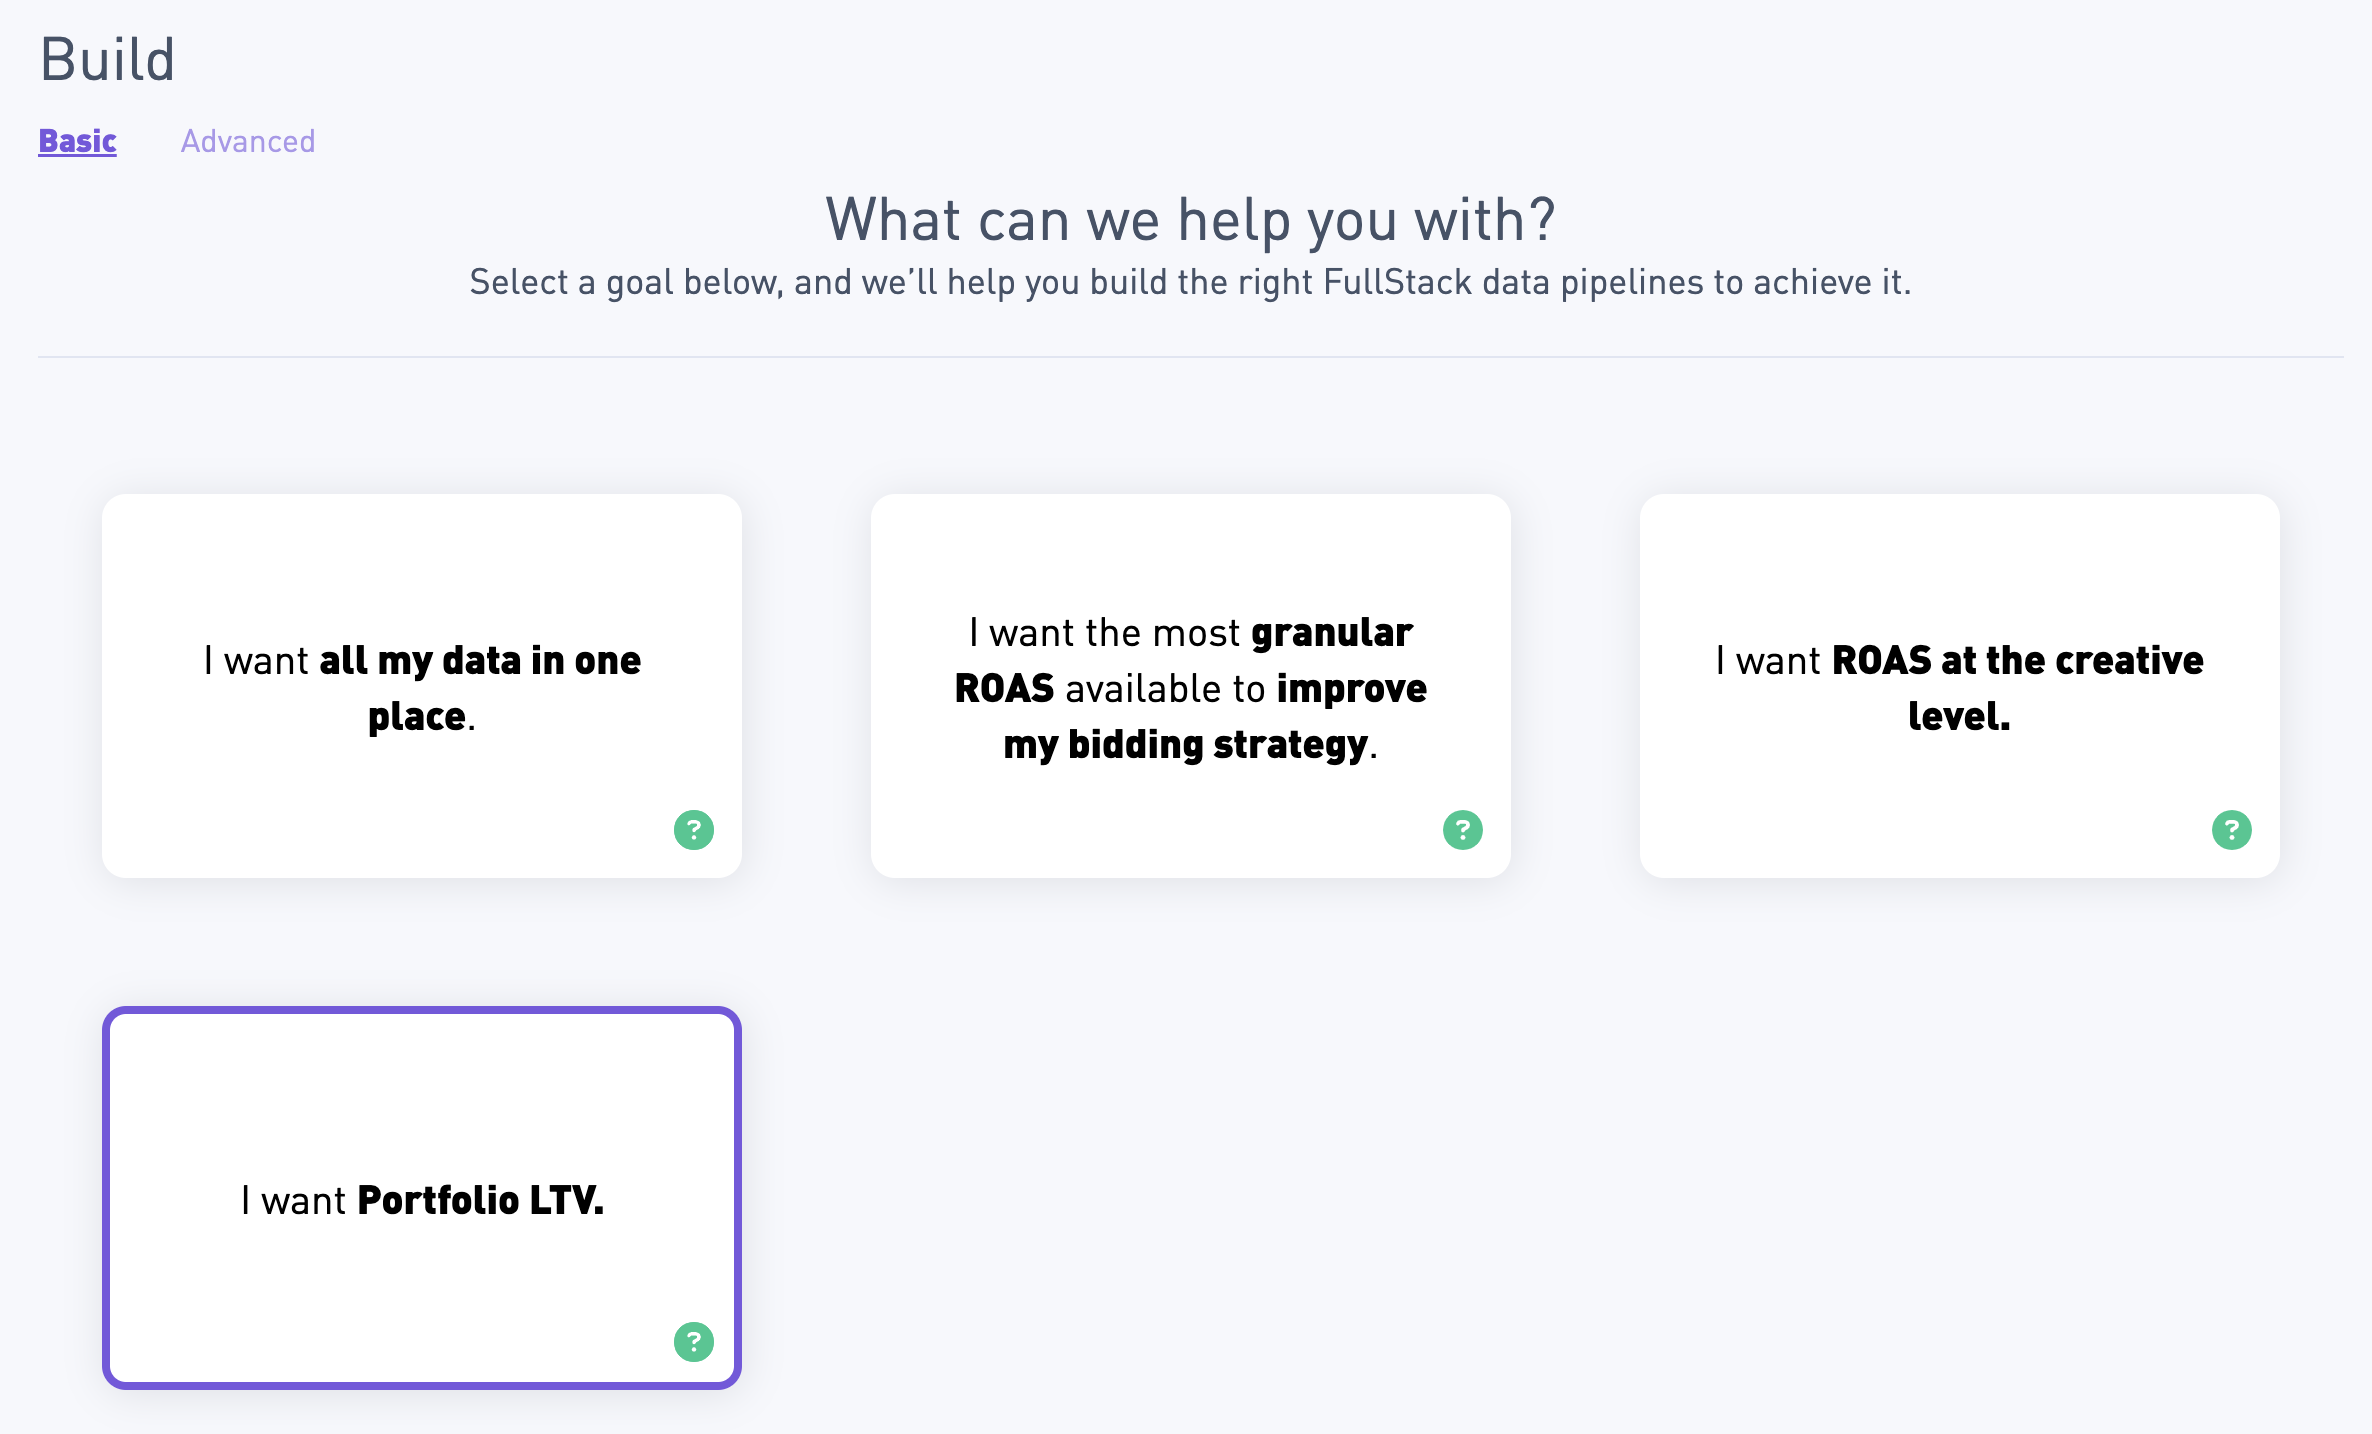
Step 2: In the Basic Build page, select “I want Portfolio LTV”. Follow the steps and provide us with the needed credentials. This will create a new stack and Growth Fullstack will start creating the related tables in your database.
Step 3: Connect to your Google Data Studio account. If you don’t already have an account, you can create one here for free.
Step 4: In Looker Studio, on the top left corner click “Create” and select “Data source”. Connect to the same Data Warehouse you provided for step 2.
Step 5: Once your database is connected, pick “Custom Query” and paste the query from this github repo.
Step 6: Once your Data source is created, go to “Fields” and “Add A Field”. Select “Add calculated field”. Copy paste the name of the field and formulas below to create as many calculated fields as needed:
| Field name | Formula |
| D60 Actual Cross promo users revenue | sum(case when apps_played=’several’ then d60_ltv_lead_app_before+ IFNULL(d60_ltv_lead_app_after,0)+ifnull(d60_ltv_other_app,0) end) |
| d60_ltv_lead_app_before_per_user_single | sum(case when apps_played=’single’ then d60_ltv_lead_app_before end)/sum(case when apps_played=’single’ then lead_app_installs end) |
| D60 Estimated Revenue if not cross promoted | d60_ltv_lead_app_before_per_user_single * sum(lead_app_installs_several) |
| D60 Estimated cross promo result | d60_actual_cross_promo_users_revenue – D60 Estimated Revenue if not cross promoted |
| D60 LTV / User from Lead App | sum(D60_lead_app)/sum(lead_app_installs) |
| D60 LTV / User from Portfolio | sum(d60_portfolio_revenue)/sum(lead_app_installs) |
| D60 LTV/ User from Lead App After Cross Promo | sum(d60_ltv_lead_app_after)/sum(lead_app_installs) |
| D60 LTV/User from other Apps | sum(d60_ltv_other_app)/sum(lead_app_installs) |
Step 7: Click on this link to view our anonymized template dashboard. Click the 3 dots on the top right and select “Make a copy”. This will show you a pop-up to select the new datasource you just created.
Et voila!
If you do not have a Data Warehouse, do not see the transformation you want available for the attribution provider you pick or if you need any kind of help please click “Book a Demo” on the top right for us to assist you in a screen-sharing meeting.
FAQ
Can this dashboard be personalized as per my requirements?
Yes. In the “Calculated Fields” section of Data Studio, you will be able to see the available fields, metrics and dimensions.
Your Growth FullStack Account Manager will be able to help you personalize this dashboard.
Is this dashboard supported with other tools?
Only the Looker Studio dashboard is free, but if you are on a paid plan with Growth Fullstack we can build something similar with Tableau, Looker, Mode and other BI Tools. Contact your Growth FullStack Account Manager for more details or email us at info@growthfullstack.com.