AppLovin Advertiser & Publisher Metrics
Overview
Learn how to use Google Data Studio dashboards to view your AppLovin advertiser, publisher and ROI metrics
Upon completion of this training, you will have a comprehensive overview of the following:
- What data and metrics you can get from the AppLovin Reporting Metrics API
- And how you can calculate ROI with the API data
Here’s a glimpse of what your Google Data Studio dashboard with these metrics could look like:

Important Note: All our Paid trainings include SQL/dashboard/script for which access is only provided to customers who have a paid subscription to the service. You can get in touch with us if you would like to subscribe.
Summary
What you will learn
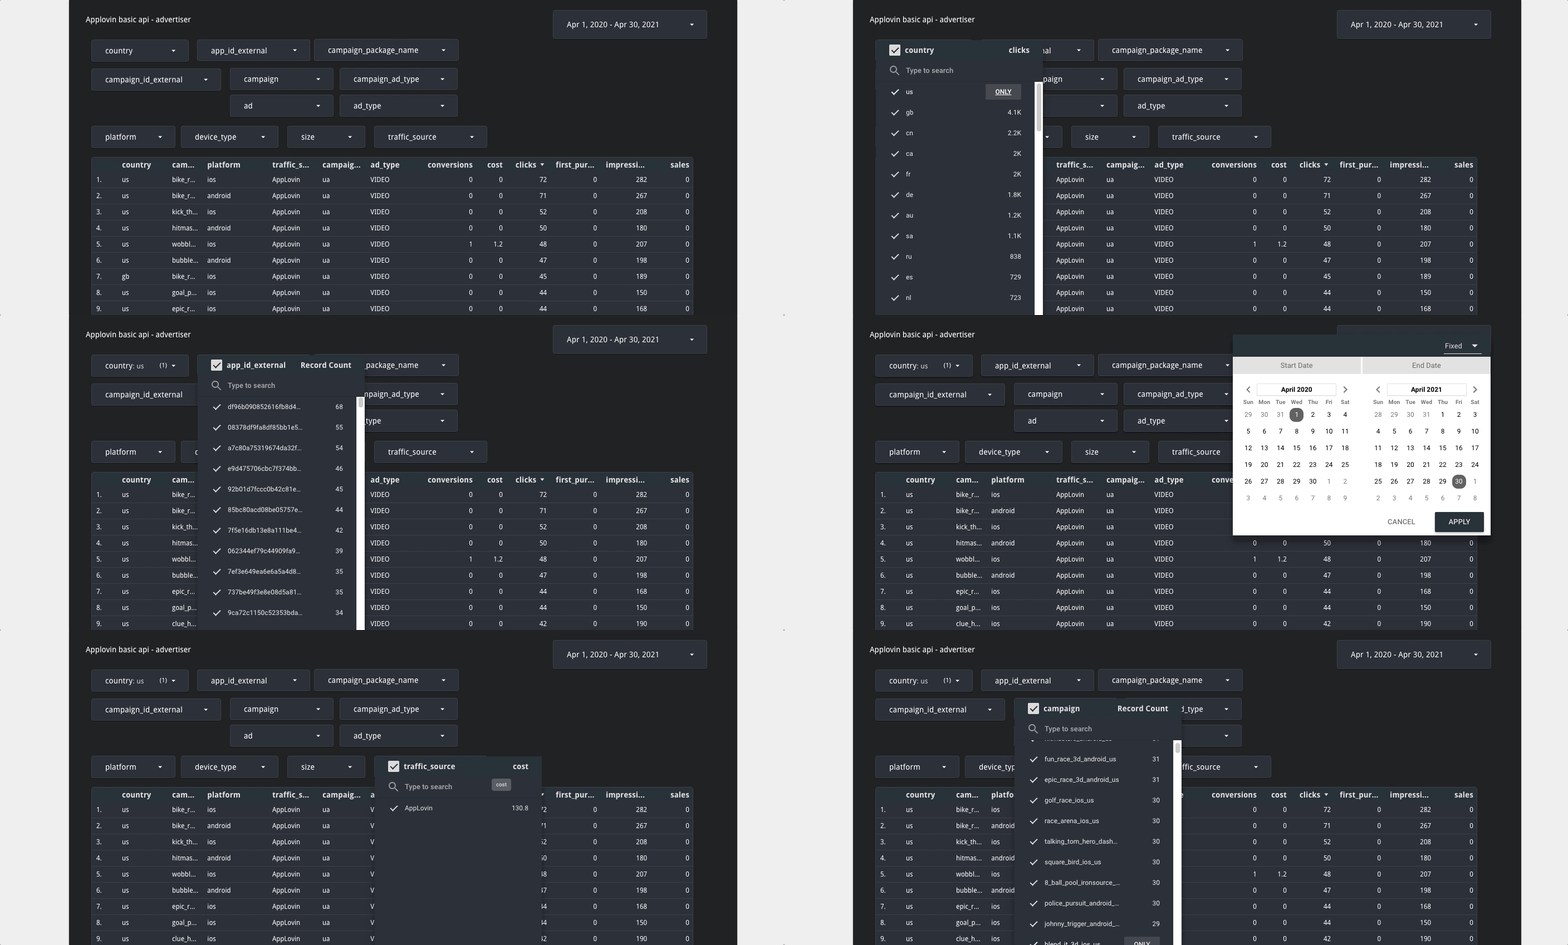
This training shows a Google Data Studio dashboard with the following 3 views from the AppLovin Basic Reporting Metrics API.
- Advertiser view, which includes impressions, clicks, costs per campaign and ad type
- Publisher view, which includes impressions, clicks, revenue per campaign and ad type
- Merged ROI view, which includes advertiser and publisher data joined on common dimensions to create a ROI calculation
If you would like to learn how to analyze the associated data, contact your Growth FullStack Account Manager. And if you are using Growth FullStack’s ETL App, you will be able to use these dashboard views as templates and personalize the analysis as required.
Setup
The associated Growth FullStack training offers to analyze the performance of:
- Your ad purchases (advertiser endpoint)
- Your ad revenue (publisher endpoint)
- ROI on the common dimensions: package_name, platform, device_type, country, day
Setup Options
You can choose from the following options to pull your AppLovin reporting metrics data:
Option 1: ETL Options To Pull From The Applovin Reporting API:
1. Do it yourself:
With the help of the official Applovin Reporting API Docs
2. Via the Growth FullStack ETL App:
Our “data pipeline as a service” can deliver raw data, reports, and automated decisions to your data warehouses or tools. Contact your Account Manager if you have any questions.
3. Via a Python Script
We can share a Python Script that you can run on your local or virtual environment and pipe the response into your data lake. You can also use our managed ETL data service where we will maintain and run the script for you. Contact your Account Manager if you would like to use this option.
II. Pre-built Growth FullStack Dashboard Templates:
1. Do it yourself:
Applovin ROI view optimised for BigQuery: This query is optimized for Google BigQuery and supports the dashboard ROI view. It is a calculated view, so you only need to have the data routed into your data warehouse. The code is available to GA & Tenjin clients on advanced tiers.
2. Reuse pre-built dashboard templates:
While the associated anonymized demo is in Google Data Studio, we support a wide range of analysis across multiple destinations, such as:
- BI tools (eg Tableau, Looker, Metabase)
- notebooks (eg Google Collab, Jupyter Notebooks)
- spreadsheets (Excel, Google Spreadsheets)
Contact your Account Manager for a demo or if you have any questions.
Support
- Growth FullStack maintains the code in this repo.
- For clients using our ETL app and dashboards, we offer cuztomization options and 24h turnaround on any issues.
Resources
How to
Get access to the anonymized template below:
Note: This template is available for a wide range of BI tools such as Looker, Metabase or Tableau. Feel free to get in touch with your Growth FullStack Account Manager for any additional details on the matter
Google Data Studio Dashboard views
The dashboard has the following 3 views:
View 1: Advertiser view with impressions, clicks, costs per campaign and ad type

View 2: Publisher view with impressions, clicks, revenue per campaign and ad type

View 3: Merged ROI view created and supported by Growth FullStack—advertiser and publisher data joined on common dimensions to calculate ROI

The common dimensions for this join are: package_name, platform, device_type, country, day.
Note: Column “app_id_external” is used by AppLovin to denote the site ID value.
FAQ
Can this dashboard be personalized as per my requirements?
Yes. Your Growth FullStack Account Manager can help personalize this dashboard.

Feedback
Do you have any feedback for us?
We at Growth FullStack are always happy to receive your valuable feedback. Whether it’s about requesting additional support on optimizing your workflows, building a customized dashboard, or anything else, feel free to reach out to us and let us know how we can support you further.
Iterate and Maintain
Iterate
As discussed, this dashboard can be edited.
Maintain
Please be aware that AppLovin frequently updates its API and this may break the dashboard templates.
