Tenjin Tutorial: Reporting API to Spreadsheets
Overview
With this use case, you will learn how to pull your data from Tenjin’s Reporting Metrics API to Google Spreadsheets with just one click! You will be able to do this via a Google App Script. The script is ready to go and does not require any engineering resources at your end. All you need to do is “copy and paste” the script, which will simply query Tenjin’s Reporting Metrics API and copy your app’s metrics to the spreadsheet immediately.
Table of Contents
- How to visualise Tenjin’s data (full list)
- Why you should use a script to pull your data (advantages and limitations)
- Who will benefit from this use case
- How you can use the script (step-by-step)
- Send us your feedback
How to analyse Tenjin’s data
The following is a list of the most common ways to visualize Tenjin’s data:
- Through using the Tenjin Dashboard
- By exporting raw data from the dashboard in a CSV format
- By exporting raw data from the API directly to Google Spreadsheets (this is the one we will focus on today)
- By exporting raw data from the API using custom scripts
- Through using Tenjin’s Datavault, a managed Amazon Redshift data warehouse, which is available to all Tenjin customers using the “Advanced Plan“
Getting started with exporting raw data from Tenjin’s Reporting Metrics API to Google Spreadsheets
Why you should use a script to pull your data into Google Spreadsheets via Tenjin’s Reporting Metrics API
Google Spreadsheets are the easiest way to store raw data. If you are a Tenjin user, you can automatically pull data from Tenjin’s APIs into a Google Spreadsheet without having to log in to the Tenjin Dashboard>>Data Exporter>>Downloading a csv each time.
This method has both advantages and limitations when compared to the other methods mentioned above.
Advantages :
- Exporting data from Tenjin enables you to run a custom analysis
- This workflow is faster and more robust than exporting .CSV files manually
- You do not require any coding skills, prior setup, or engineering resources for this method
- Most people already know how to use Google Spreadsheets prior to implementing this
- You can make use of Google Spreadsheets’ in-built pivot tables, graphs and other visualisation tools, or connect the spreadsheet to other tools such as Tableau or Google Data Studio. If you wish to do that, please contact us
Limitations:
- The script has to be called manually
- Google Spreadsheets has a limit of 5 million cells only (more information here)
- The Reporting Metrics API gives access to fewer metrics and less data granularity than Tenjin’s Datavault.
Who will benefit from this use case:
We recommend this use case and workflow for those who wish to improve their User-Acquisition & Data Analysis workflows for a few low-scale apps, but as soon as the business starts to grow the limitations of the workflow become more apparent.
How you can use the script (step-by-step):
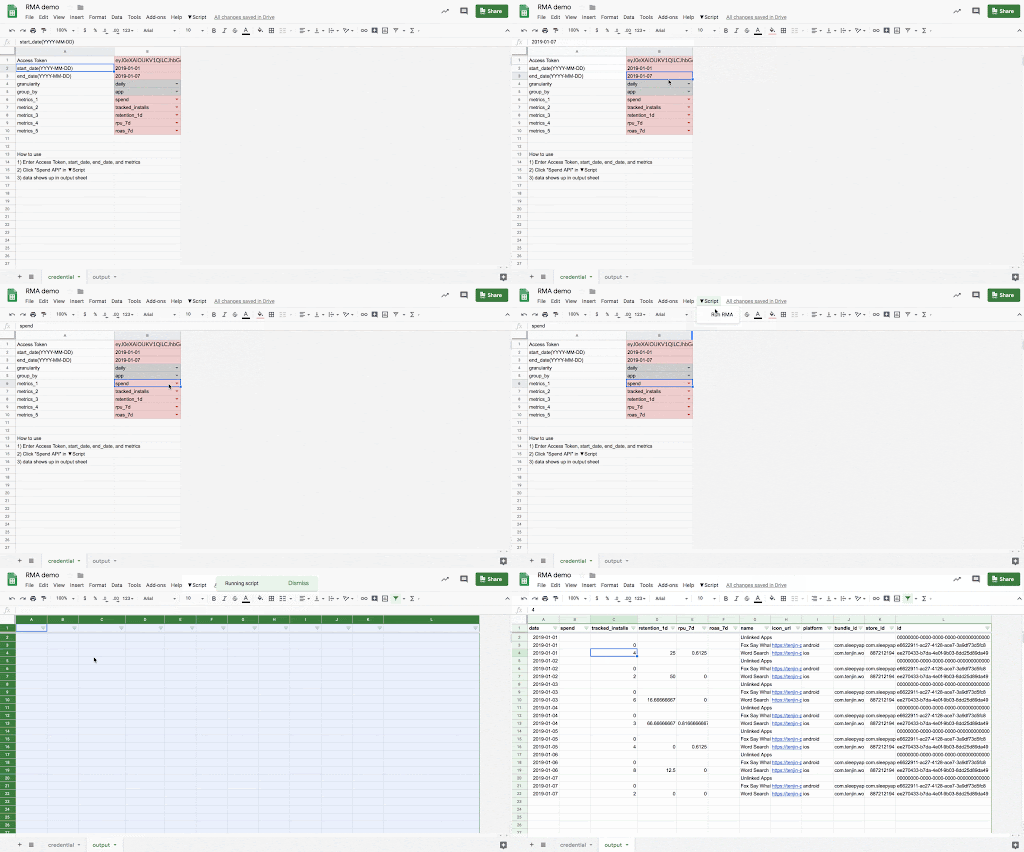
- Make a copy of this spreadsheet
- Paste your API key in the B1 cell. You can generate API Keys here. Note that anyone with your API keys can access your data, so keep them a secret, and renew them often
- Set a start_date and end_date
- Select the granularity you want (daily/weekly…)
- Select the group-by you want (app/campaign…)
- Select the different metrics you want
- Click on Script -> Run Script
- Your data will get populated in the output cell
The GIF below summarises how the script works:

You’re all done!
You can now make use of this data to run custom calculations and data visualisations in Google Spreadsheets, or connect the spreadsheet to other tools like Google Data Studio or Tableau for a more robust data analysis.
Send us your feedback
Your feedback helps us constantly improve and update our current use cases, or in creating new use cases as per demand. If you have any questions regarding this use case, or would like to have a further discussion on the topic, then reach out to us at info@growthfullstack.com.